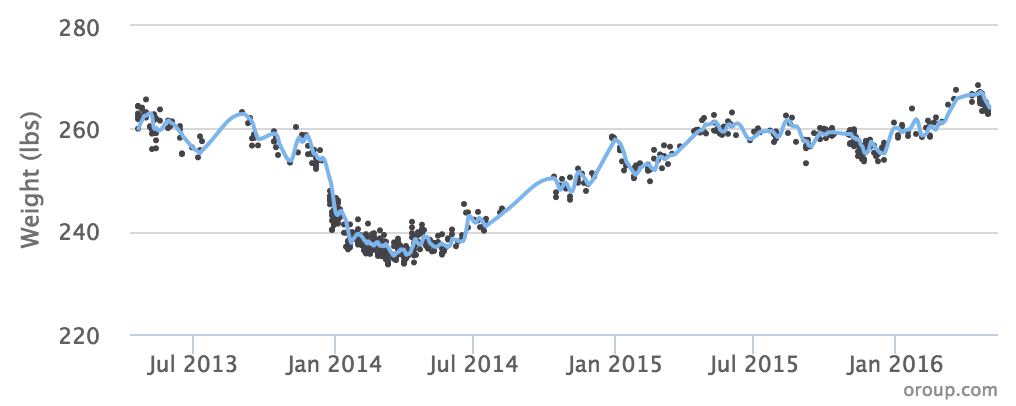
A number of years ago I bought a Withings connected scale. It’s great. You get on every morning, it logs your weight and uploads it to the internet where it can be analyzed.
Recently, I decided to use the Withing API to build a plot that I could include on my homepage to keep an eye on my weight. Something every weight-watcher knows though is your weight fluctuates and so it’s great to keep an average. Unfortunately, unevenly spaced time series do not interact well with simple moving averages, so I found this paper and converted the code into javascript:
|
1 2 3 4 5 6 7 8 9 10 11 12 13 14 15 16 17 18 19 20 21 22 23 24 25 |
var tau = 1000 * 60 * 60 * 24 * 3.5 // 1/2 week var i = 0 var left = 0 var t_left_new, roll_area, left_area, width, weight, y2 var avg_data = [[json_data[0][0], json_data[0][1]]] roll_area = left_area = json_data[0][1] * tau for (i = 1; i < json_data.length; i++) { roll_area += (json_data[i][1] + json_data[i – 1][1]) / 2 * (json_data[i][0] – json_data[i – 1][0]) roll_area = roll_area – left_area t_left_new = json_data[i][0] – tau while (json_data[left][0] < t_left_new) { roll_area = roll_area – (json_data[left][1] + json_data[left + 1][1]) / 2 * (json_data[left + 1][0] – json_data[left][0]) left++ } width = json_data[left][0] – t_left_new if ((left === 0) || (width === 0)) { left_area = width * json_data[0][1] } else { weight = width / (json_data[left][0] – json_data[left – 1][0]) y2 = json_data[left – 1][1] * weight + json_data[left][1] * (1 – weight) left_area = width * (y2 + json_data[left][1]) / 2 } roll_area = roll_area + left_area avg_data[i] = [json_data[i][0], roll_area / tau] } |
The algorithm expects data in a variable called json_data. It’s an array of arrays, each of which is a timestamp and data pair. (This is the form that Highcharts expects.) The key factor is tau, the length of the time window over which you’re averaging. I have it set to a week here which I think is about right for looking at human weight. (3.5 days works quite well too.)
The results are here:
The code in context and a cleaner running example are both available. You can also see the raw data I use to fuel the graph.
